Phase Diagrams and Phase Transformations
Introduction
Phase diagrams and phase transformations are fundamental concepts in the field of Material Science in Engineering. These concepts are crucial for understanding the behavior of materials under different conditions, such as temperature and pressure, and for predicting the properties and performance of materials in various applications. Phase diagrams provide a graphical representation of the stability of different phases of a material, while phase transformations describe the changes that occur between these phases. Together, they form the backbone of materials engineering, enabling engineers to design and optimize materials for specific applications.
Fundamentals
Phase Diagrams
A phase diagram is a graphical representation that shows the stability of different phases of a material as a function of variables such as temperature, pressure, and composition. The most common type of phase diagram is the temperature-composition diagram, which is used to represent binary alloy systems. Key components of phase diagrams include:
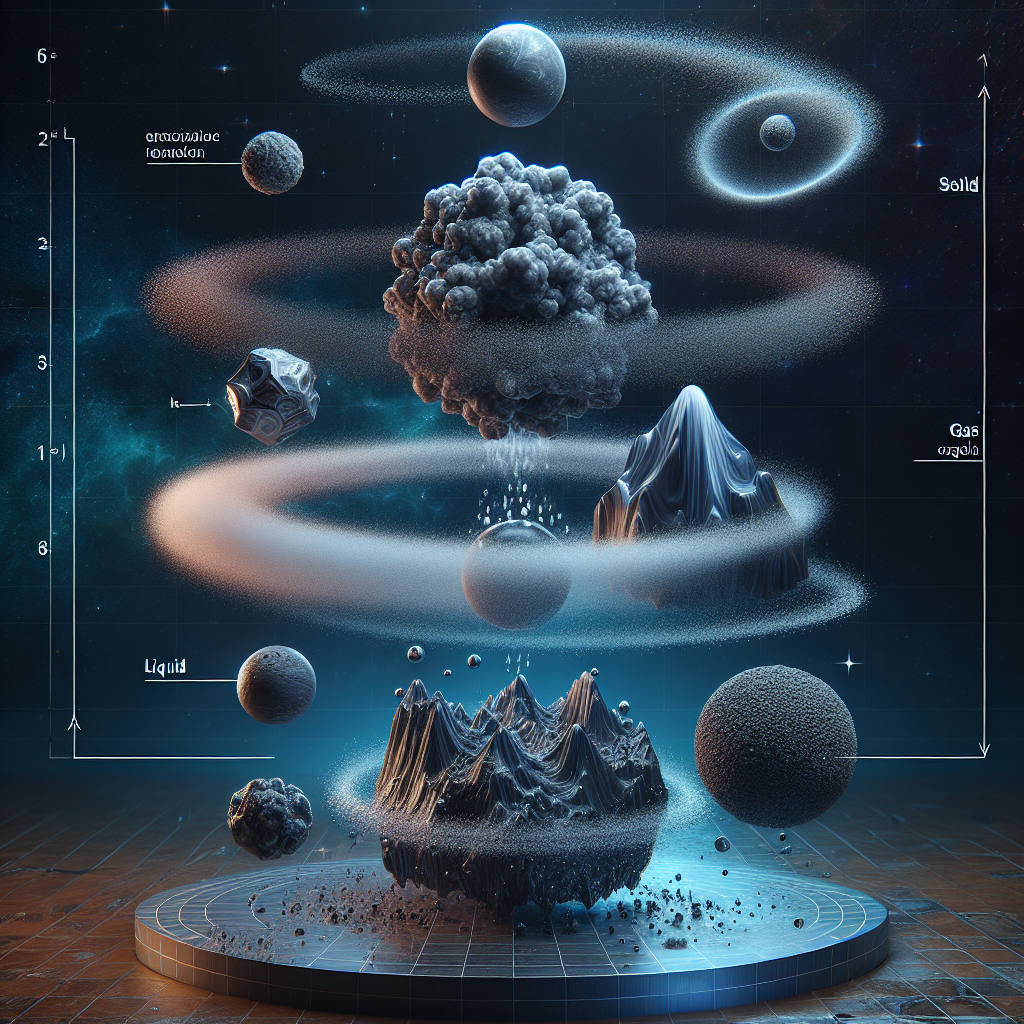
- Phases: Distinct forms of matter, such as solid, liquid, and gas, that have uniform physical and chemical properties.
- Phase Boundaries: Lines or curves on the diagram that separate different phases. These boundaries indicate the conditions under which two phases coexist in equilibrium.
- Critical Points: Specific points on the diagram where unique phase behavior occurs, such as the critical temperature and pressure where a substance can exist as both a liquid and a gas.
- Triple Points: Points where three phases coexist in equilibrium.
Phase Transformations
Phase transformations refer to the changes that occur between different phases of a material. These transformations can be classified into several types:
- Solid-Solid Transformations: Changes between different solid phases, such as the transformation of graphite to diamond.
- Solid-Liquid Transformations: Melting and solidification processes, such as the melting of ice to water.
- Liquid-Gas Transformations: Evaporation and condensation processes, such as the boiling of water to steam.
- Solid-Gas Transformations: Sublimation and deposition processes, such as the sublimation of dry ice to carbon dioxide gas.
Understanding these transformations is essential for controlling the microstructure and properties of materials, which in turn affects their performance in various applications.
Historical Development
The study of phase diagrams and phase transformations has a rich history, with significant contributions from many notable figures in the field of Material Science. Some key milestones include:
- Gibbs Phase Rule (1876): Josiah Willard Gibbs formulated the phase rule, which provides a mathematical framework for understanding the number of phases that can coexist in equilibrium. The phase rule is given by F = C – P + 2, where F is the number of degrees of freedom, C is the number of components, and P is the number of phases.
- Lever Rule (1900s): The lever rule is a graphical method used to determine the proportions of different phases in a two-phase region of a phase diagram. It is named after the mechanical lever, as it uses a similar principle of balance.
- Iron-Carbon Phase Diagram (1930s): The development of the iron-carbon phase diagram was a significant milestone in metallurgy. This diagram is essential for understanding the behavior of steel and cast iron, which are critical materials in engineering and construction.
These foundational concepts have paved the way for modern advancements in the field, enabling engineers to design and optimize materials with unprecedented precision.
Applications
Phase diagrams and phase transformations have a wide range of practical applications in various industries and fields. Some notable examples include:
Metallurgy
In metallurgy, phase diagrams are used to design and optimize alloys for specific applications. For example, the iron-carbon phase diagram is essential for understanding the behavior of steel and cast iron, which are critical materials in construction, automotive, and aerospace industries. By controlling the composition and heat treatment of these materials, engineers can achieve desired properties such as strength, hardness, and ductility.
Semiconductor Industry
Phase diagrams are also crucial in the semiconductor industry, where precise control of material properties is essential for the fabrication of electronic devices. For example, the silicon-germanium phase diagram is used to design semiconductor alloys with specific electrical properties for use in transistors, diodes, and integrated circuits.
Ceramics and Glasses
In the ceramics and glass industries, phase diagrams are used to design materials with specific thermal, mechanical, and optical properties. For example, the silica-alumina phase diagram is used to design refractory materials that can withstand high temperatures in furnaces and kilns.
Pharmaceuticals
Phase diagrams are also used in the pharmaceutical industry to design drug formulations with specific solubility and stability properties. For example, the phase behavior of drug compounds in different solvents can be used to design formulations with improved bioavailability and shelf life.
Advanced Topics
Computational Phase Diagrams
Recent advancements in computational methods have enabled the development of computational phase diagrams, which use thermodynamic models and computational algorithms to predict phase behavior. These methods can be used to design new materials with specific properties and to optimize existing materials for specific applications.
Nanomaterials
The study of phase diagrams and phase transformations in nanomaterials is an emerging field of research. Nanomaterials exhibit unique phase behavior due to their small size and high surface area, which can lead to novel properties and applications. For example, the phase behavior of nanoparticles can be used to design materials with enhanced catalytic, optical, and mechanical properties.
High-Throughput Experimentation
High-throughput experimentation is a technique that uses automated methods to rapidly generate and analyze large amounts of data on phase behavior. This approach can be used to accelerate the discovery and optimization of new materials, enabling the development of materials with unprecedented properties and performance.
Challenges and Considerations
Despite the significant advancements in the field, there are still several challenges and considerations associated with phase diagrams and phase transformations:
- Complexity: The complexity of phase diagrams increases with the number of components and phases, making it challenging to accurately predict phase behavior in multicomponent systems.
- Experimental Limitations: Experimental methods for determining phase diagrams can be time-consuming and expensive, and may not always provide accurate results for complex systems.
- Computational Limitations: Computational methods for predicting phase behavior are limited by the accuracy of the underlying thermodynamic models and the computational resources available.
- Environmental Considerations: The environmental impact of materials and their phase transformations must be considered in the design and optimization of new materials. This includes considerations such as energy consumption, waste generation, and recyclability.
Addressing these challenges requires ongoing research and innovation in both experimental and computational methods, as well as a multidisciplinary approach that integrates knowledge from materials science, chemistry, physics, and engineering.
Conclusion
Phase diagrams and phase transformations are fundamental concepts in the field of Material Science in Engineering. They provide essential insights into the behavior of materials under different conditions and enable the design and optimization of materials for a wide range of applications. From metallurgy to semiconductors, ceramics to pharmaceuticals, these concepts have a profound impact on various industries and fields. Despite the challenges and limitations, ongoing research and innovation continue to advance our understanding of phase behavior and to develop new materials with unprecedented properties and performance. As such, phase diagrams and phase transformations remain a cornerstone of materials engineering, driving progress and innovation in the field.